│By Sarah L. Ketchley, Senior Digital Humanities Specialist│
This is a follow-up blog post to last month’s overview of working with Storymaps in the DH classroom. We will consider a few more ways to engage students in the creative and intellectually rigorous process of building Digital Humanities projects, conducting analyses, and demonstrating the outcomes of a quarter or semester’s-worth of work. Developing timelines, exhibits and maps involves making use of Gale Digital Scholar Lab’s export functionality, which includes the ability to download:
- The OCR text output of up to 5,000 documents in any given content set.
- The full metadata of a content set, up to 10,000 documents.
- Individual document images.
- Analysis visualisations in multiple image formats.
- Analysis raw data in CSV or JSON formats.
- Documentation and records completed using the Notebook feature, in multiple text formats.
This exported information can then be used as the underlying data for a variety of interactive and public-facing student assignments.
Timelines
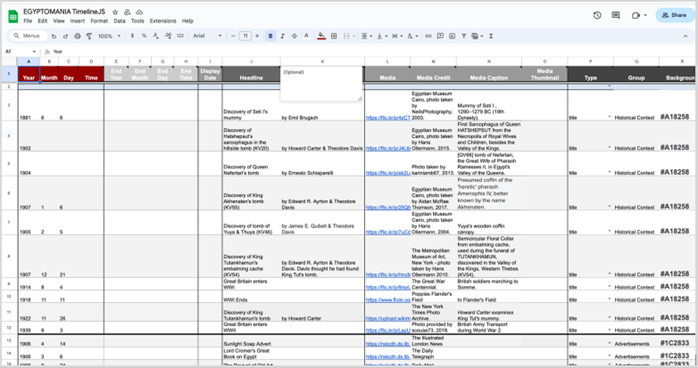
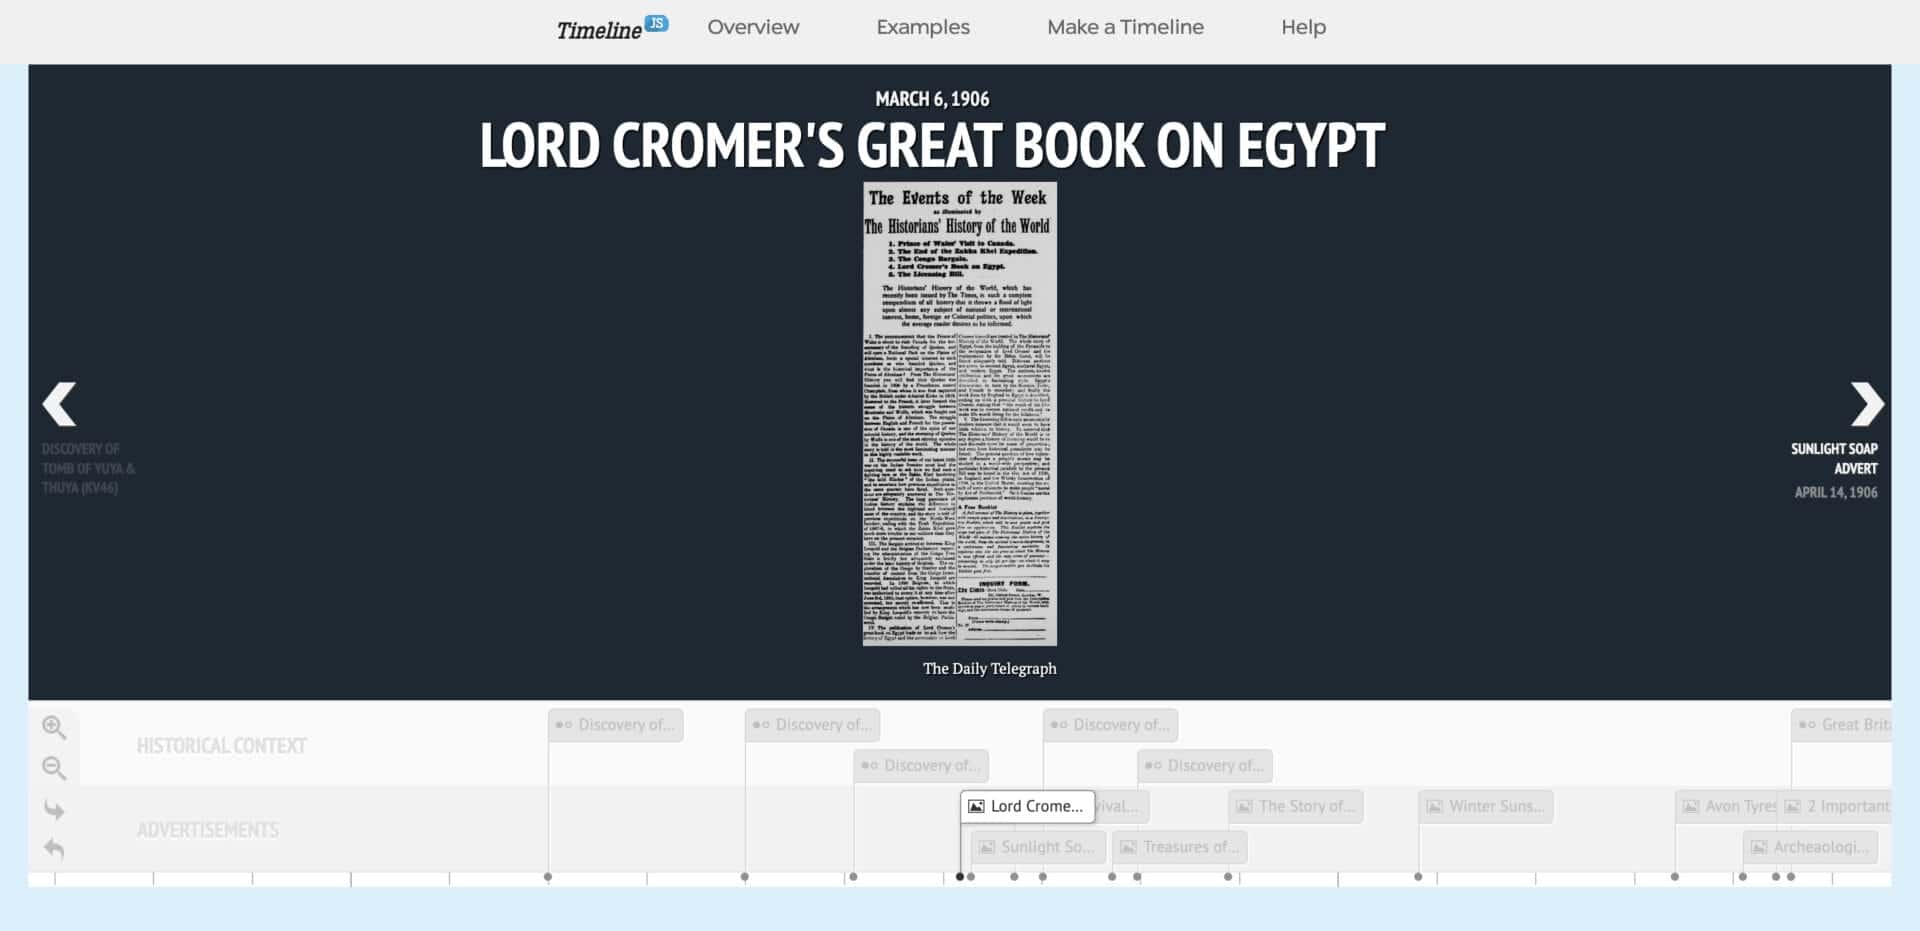
TimelineJS is a sister-tool to StoryMapJS, also created by Knight Lab. This tool is an effective way to show changes over time, which could be aligned with Sentiment over Time analysis output. The backend of the tool is a straightforward Google Sheet, which is completed with dates, captions, and images to be displayed on the timeline. Clicking ‘Publish to the Web’ generates a URL that TimelineJS then renders into an interactive display. The Gale Digital Scholar Lab’s metadata export feature is useful in helping complete the Google Sheet, whilst downloaded individual documents can be used in the image fields.
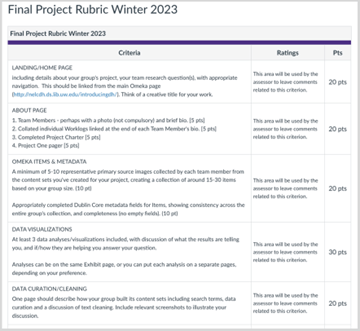
Digital Exhibits
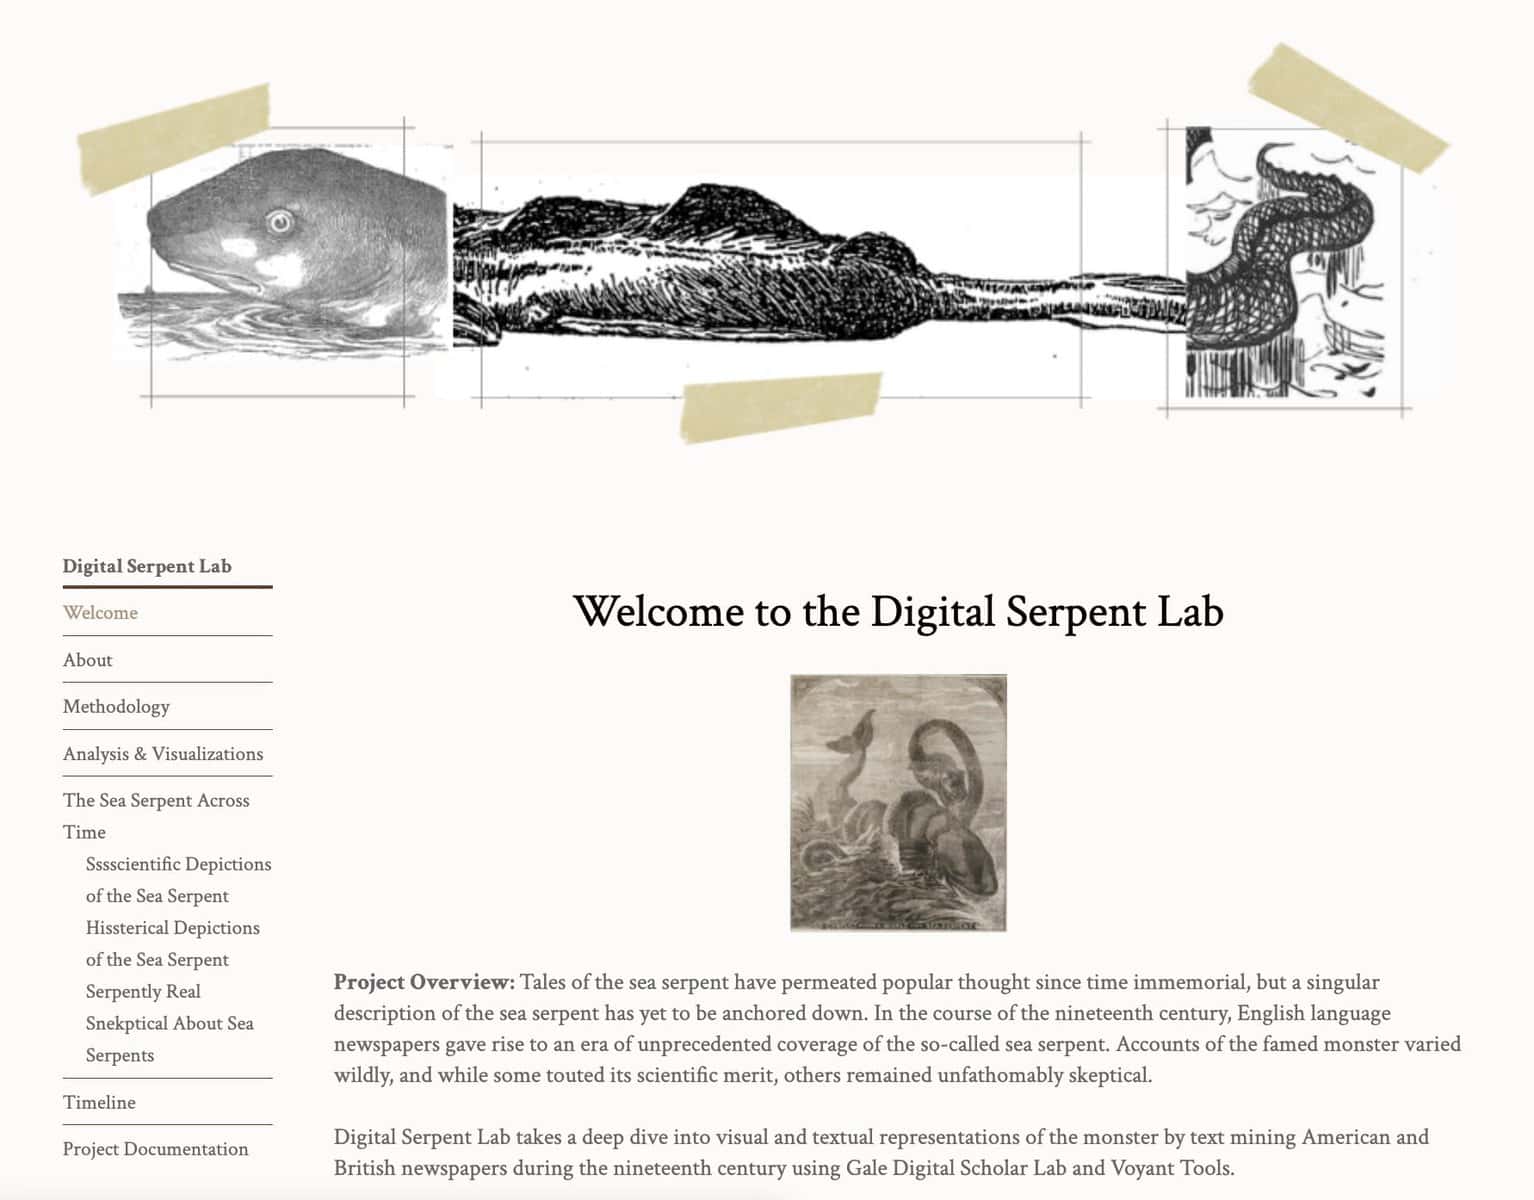
I use Omeka as my primary content management system when I teach introductory classes in Digital Humanities. My institution (the University of Washington) provides hosting, but in the absence of this service, it is possible to set up an account on omeka.net which is hosted by the Corporation for Digital Scholarship. A final assignment could provide rubric guidance for building a digital exhibit in either Omeka space, to include guidance for the content of each page in the exhibit, as well as the expectations for formatting individual Omeka items, images, and metadata.
The Gale Digital Scholar Lab’s export functionality works well with Omeka, particularly the batch upload, CSV import and Bulk Metadata Editor plugins.
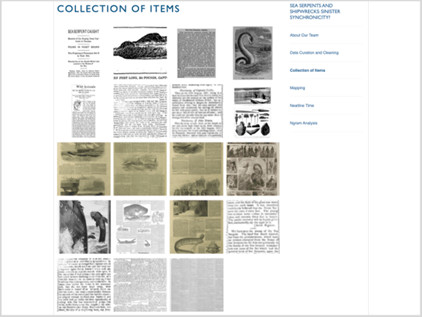
All visualisation images and interactive outputs such as maps, timelines and story maps can be embedded in an exhibit page. Individual images, such as newspaper articles or editorials, can be uploaded into the platform and described using Dublin Core metadata, which provides opportunities for students to learn to describe their items in a standardised yet complete way.
Worthy of note is the option to create timelines and maps in Omeka using Neatline or Neatline Time, a suite of add-on tools fully integrated in the backend of the platform. The learning curve is a little steeper than for TimelineJS but the advantages include straightforward integration with items already in a digital exhibit, and a single location to manage all digital collateral.
Maps
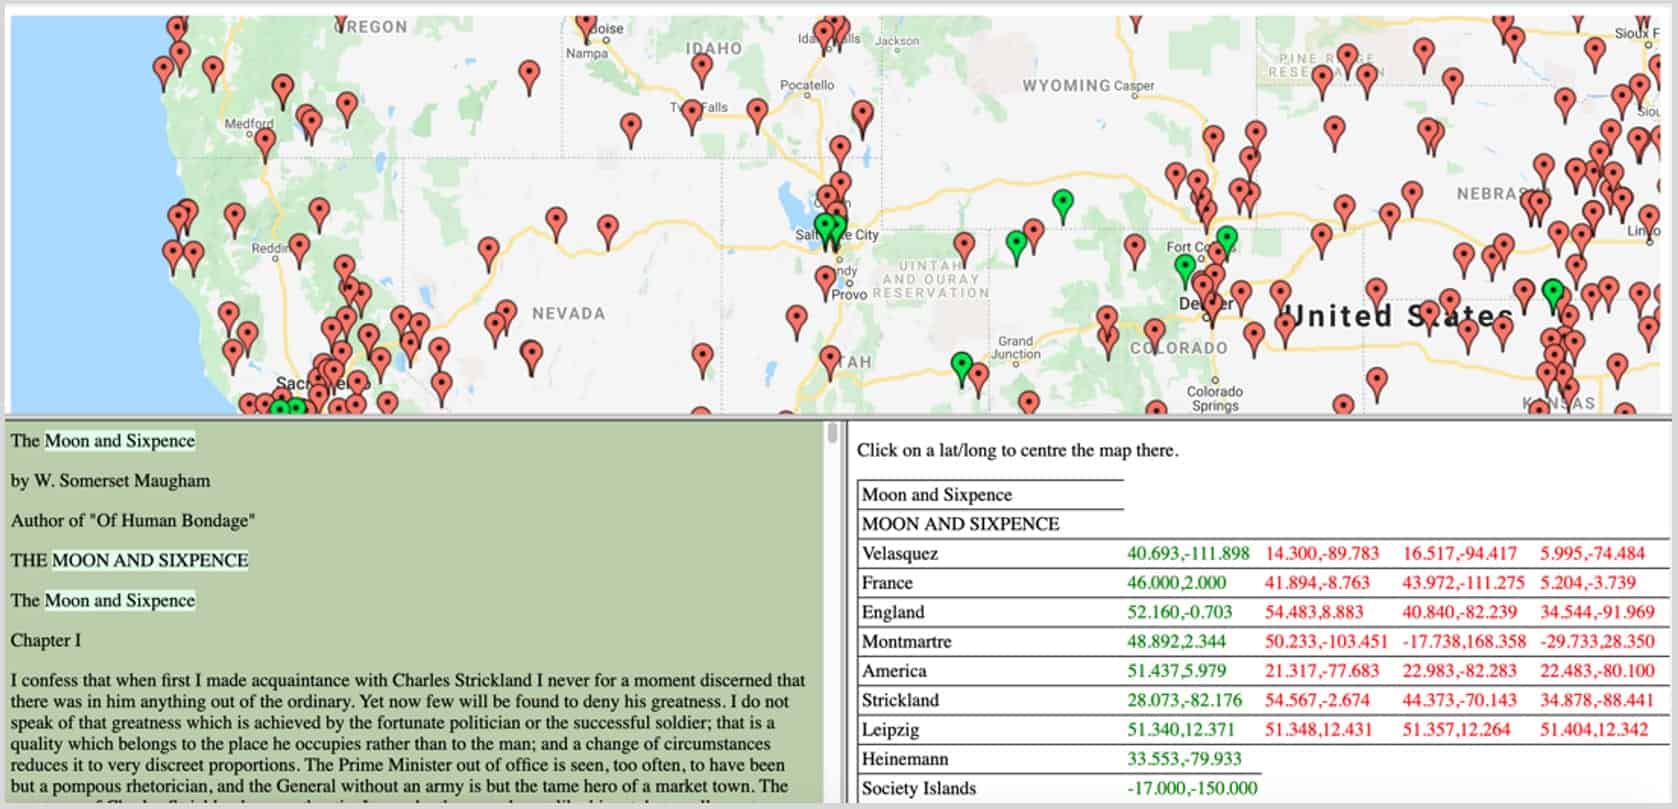
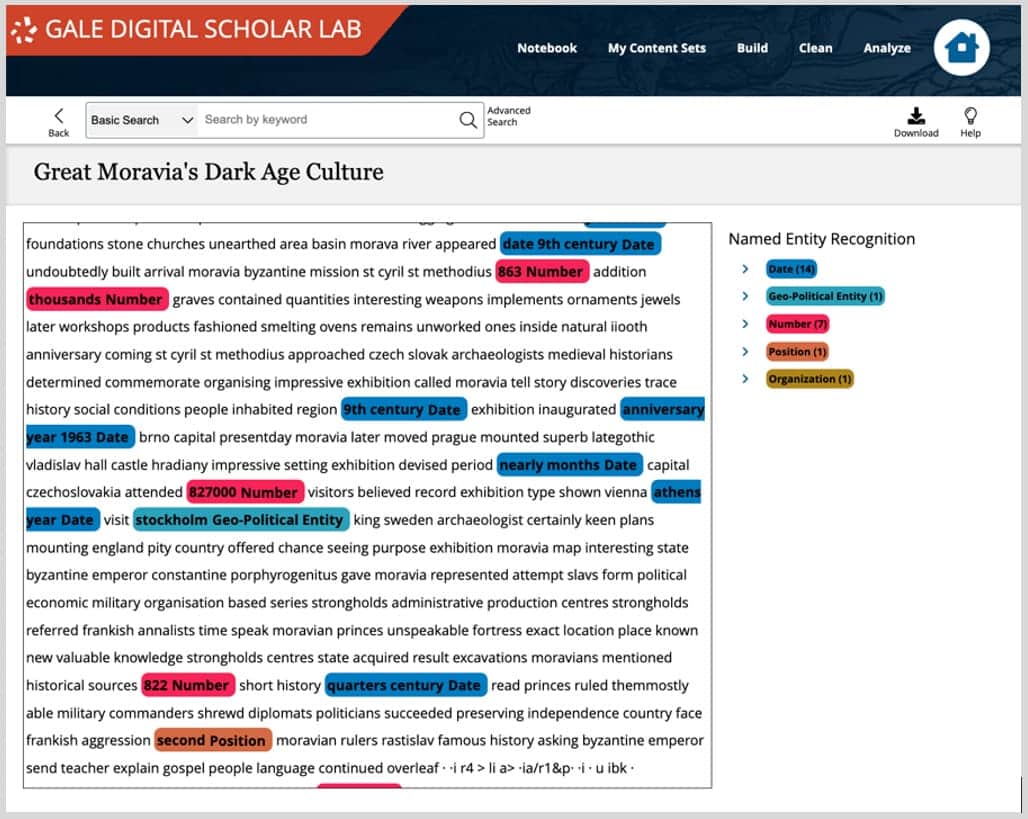
The Named Entity Recognition tool in the Gale Digital Scholar Lab provides a useful pathway for creating maps that can be used to tell research stories and provide visual context for collections of texts and data. Running a Named Entity Recognition analysis will yield results that tag each word or token in the text with one of several categories. Those relevant for mapping are geography, geo-political entity, and place.
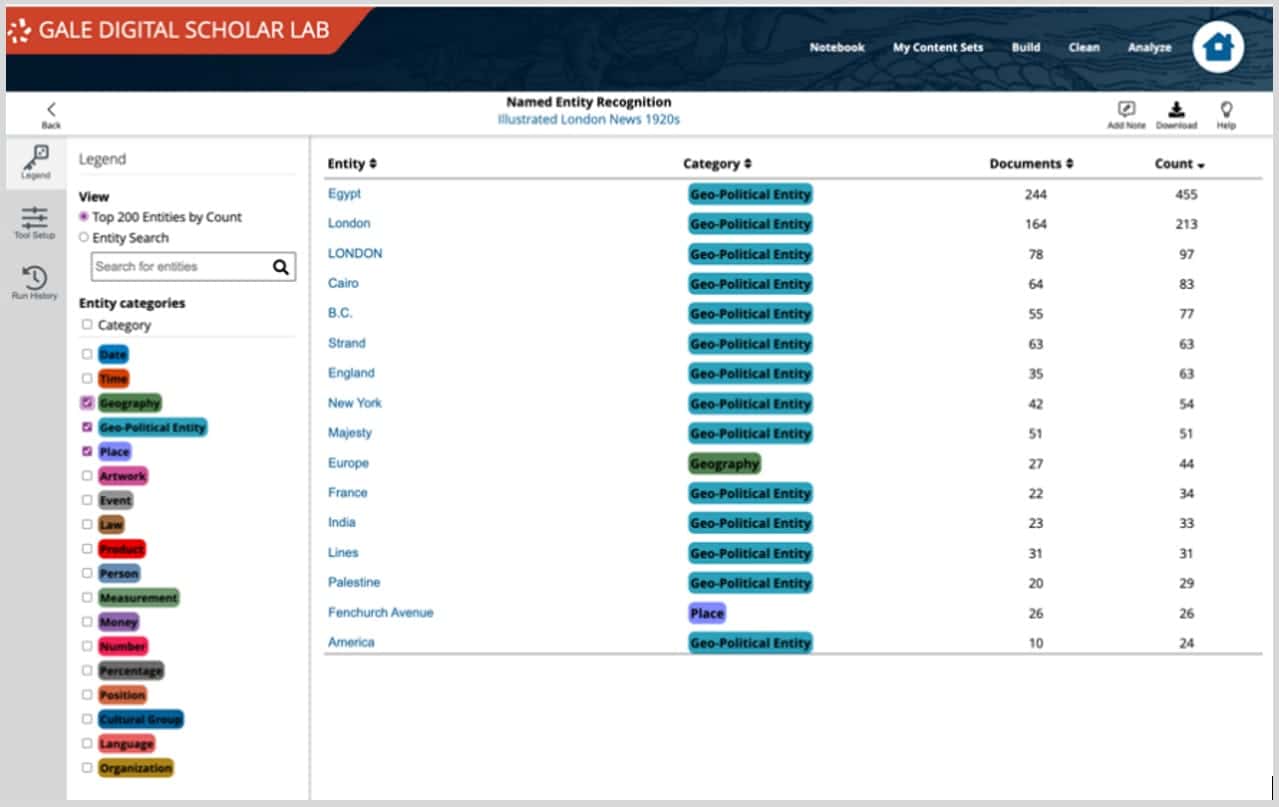
The raw data with the list of tagged entities can be downloaded as a CSV, then this information can be used as a starting point for creating a map connected to the narrative or theme of the original dataset. For example, the Edinburgh Geoparser will resolve a list of place names to geographic coordinates that can be used to generate a series of location markers on a map. A researcher may also wish to incorporate additional entity details, such as person, organisation, cultural group and so on if there is an option to add contextual notes and narrative. The Gale Digital Scholar Lab offers the option to view the original OCR text with entities highlighted to give insights into term collocations and enable close reading as part of the research process.
The Programming Historian provides a number of useful tutorials on building maps, including Introductions to Google Maps and Google Earth, and Displaying a Georeferenced Map in StorymapJS. If you are working to layer an historic map onto a modern one, you might want to consider using Mapwarper which ensures alignment between locations over time. See also information on Neatline in the Omeka section, above.
In conclusion
The process of creating interactive digital content as a final class assignment is a valuable experience for students for many reasons. The ‘traditional’ skills of learning how to engage with the research process are still foundational to successful outcomes, including effective writing, organisation of working process and research materials, and crafting a relevant research question. Additional skills students may learn range from best practices for team or collaborative working, data management and presentation, basic UX design and coding, and how to present narratives effectively in an online space.
If you enjoyed reading this blog post, check out others in the ‘Notes from our DH Correspondent’ series, which include:
- Re-imagining Assignments in the DH Classroom: StoryMaps
- Groups and Notebooks: Using Gale Digital Scholar Lab’s latest features in the DH classroom
- Digging into Datasets in Gale Digital Scholar Lab
- Birds of a Feather, Work Together – Gale Digital Scholar Lab: Groups
- King Tut and Digital Humanities: A Pedagogical Case Study
- Working with Datasets, A Primer
- A Global Community: Learning and Networking Opportunities for Digital Humanists