
│By Sirkku Ruokkeinen, University of Turku, Finland│
In 1786, the Scottish economist William Playfair (1759–1823) published the Commercial and Political Atlas, reporting on the trade balance between England and continental Europe, West Indies, and North America. The work included something never before seen in print: line and bar charts. These statistical tools, although familiar to many of us now, are in fact quite complex devices and necessitate some understanding of their structure for a successful reading. So how were Playfair’s eighteenth century readers able to understand them?
Visual devices in the pre-Playfair era
Although the bar and line charts were new, Playfair’s contemporaries were familiar with a number of other tools of visual information transmission. Timelines, tree diagrams, and tables, for example, were all used frequently. Tree diagrams were particularly popular for expressing relationships, hierarchies, and structures. Information could also be collected in tabular form, or presented through images. These were the primary methods of visualising information and structuring information visually.
Some scholars of information visualisation may discount tables as text or consider images irrelevant altogether. But the generally accepted starting point to the semiotics of visual devices is a division into tabular, diagrammatic, and representative visuals.
Gale Primary Sources takes a somewhat different approach to image classification. They utilize seventeen values or categories in describing graphs and visuals in their primary resources, and Eighteenth Century Collections Online (ECCO) employs nine of these: cartoon, chart, coat of arms, drawing, genealogical table, map, musical work, plan, and portrait. The terms are perfectly transparent to the present-day user, and hence well-motivated for extensive, cross-disciplinary datasets.
In the context of ECCO’s historical materials, however, it is not apparent what kind of taxonomy the values form. Furthermore, and more crucially, the selected terminology isn’t necessarily applicable to visual devices across centuries. Below, I discuss three cases where the ECCO values may not serve the goals of information historians: drawings, charts, and devices left unmarked.
Drawings: Diagrammatic and Representative Visuals
The Gale Primary Sources guidelines for the value of ‘drawings’ refers to “fine-art drawings and to production art used for text illustrations, such as anatomical diagrams, architectural drawings, landscapes, portraits, diagrams, and plans.” Perhaps created as a counterpoint for the value of ‘photographs’ (which does not appear in ECCO), the category of drawings includes a wide array of different types of devices with varied methods of information transmission.

The devices with this value include both diagrammatic and representative visuals. The devices may be quite technical, such as the circular calendric system on the left, or fine art drawings such as the da Vinci drawing in the middle. Obviously the two diagrammatic examples given above (left and right) differ quite a bit from the da Vinci. Instead of representative visuals, diagrams like these communicate abstract entities, models, or relationships. Their message is dependent on previously established and explicitly stated systems of communication, and the message of the device is predetermined.
All readers with the literacy to read diagrammatic devices gain the same knowledge, unlike those viewing the representative image. Hence, although all these examples may be considered information transmission tools and described as drawings, the differences in their structure and purpose make distinguishing between the devices central for a systematic study of visual information transmission.
Charts: Visual and Tabular Matrices
One of the more structurally and conceptually interesting types of device in the early modern history of information transmission is the table. Structuring textual, visual or numerical information to lines and columns is an ancient method of data organisation. A table may have two or more columns and two or more rows, which create a matrix where individual data points are the result of the crossing of information categories. Cells formed through this cross-section may have visible or invisible borders. Sometimes the table has row or column headings.
Of the examples given below, the item on the left creates a matrix or cross-section of information categories, while the item on the right rather appears to be a four-column list with a tabular visual structure.
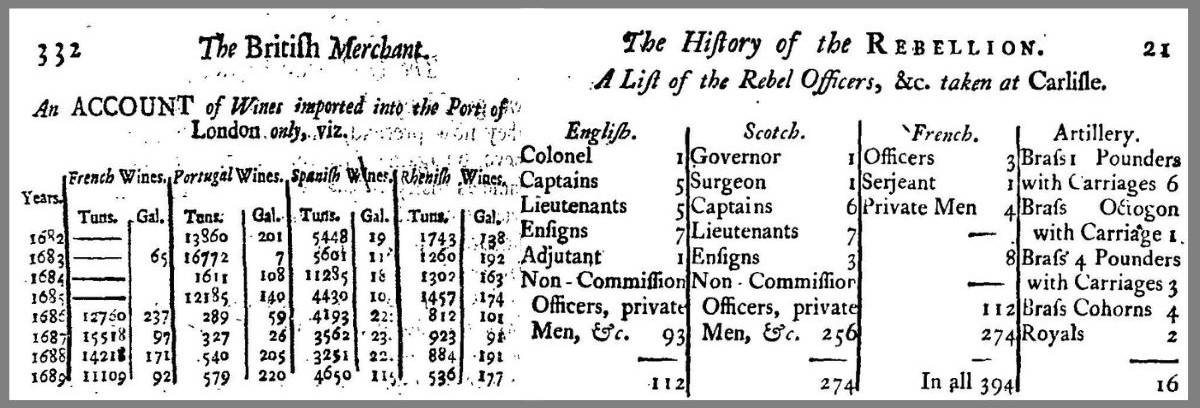
ECCO has no value for ‘table’. Rather, the examples given above may be found in ECCO marked with the value ‘chart’, which, according to the Gale Primary Sources guidelines is a “graphical display of information wherein the information is illustrated in symbols such as bars, lines, or slices”. The definition is again quite broad and allows the inclusion of numerical or textual tables even though their visual communication structure significantly differs from modern charts.
Indeed, pre-Playfair, there appears to be little in the category except tabular devices. Playfair’s trade balance chart displayed at the head of this text is one of the first printed line charts; a chart relying on data points, rather than on textual, numerical, or pictorial information arranged in rows and columns.
Visual Structures Left Unmarked
There is also a multitude of devices left unmarked within ECCO which do rely on organisational or otherwise visual means of information transmission. A particularly salient group contains tabular or otherwise structured devices in which relationships are expressed visually using braces. For example, the calculation below left is an extremely common construct within ECCO materials: a mathematical calculation on the right, and an explanation of calculated quantities on the left. The brace in between gathers the lines together into a single unit.

Although the present-day reader might dismiss braces as punctuation, historically, braces have had multiple functions. In the eighteenth century, for example, they could be used to communicate ellipsis, clustering, and hierarchies. The brace could also be used for aesthetics, for example, to cradle chapter or numbers. Differentiating between these uses is of course somewhat time consuming, but necessary for understanding the methods and strategies of information visualisation of Playfair’s contemporaries.
All in all, to understand Playfair’s new charts, the eighteenth-century reader was perhaps best served by their previous literacy in tables and tabular structures. However, more work needs to be done to fully understand how information was communicated visually, and what functions different visual structures served. Describing the devices in present-day terms and in categories designed for present-day materials risks anachronism, as the use of present-day terminology may give the wrong impression of the device. However, despite the differences in perspective described above, ECCO’s position as a source of information in this research remains unmatched.
If you enjoyed reading about visual information in ECCO, check out these posts:
