│By Sarah L. Ketchley, Senior Digital Humanities Specialist│
Continuing our exploration of the digital tools accessible through Gale Digital Scholar Lab’s intuitive interface, the Parts-of-Speech (PoS) tool enables the researcher to gain granular insights into the different parts of speech used in each document in a content set. This post will highlight the main features of the tool and provide tips about setup and options for displaying and refining analysis results. We’ll wrap up with a few examples of this quantitative analysis method used in research projects and publications.
What Parts of Speech does the Lab recognize?
The Lab uses SpaCy’s open-source model for Natural Language Processing (NLP) of syntax in Python for both Parts-of-Speech tagging and Named Entity Recognition. The model was trained using OntoNotes 5 Penn Treebank to recognize and tag parts of speech tokens in a document according to the following categories:
ADJ: adjective, e.g. big, old, green, incomprehensible, first
ADP: adposition, e.g. in, to, during
ADV: adverb, e.g. very, tomorrow, down, where, there
AUX: auxiliary, e.g. is, has (done), will (do), should (do)
CCONJ: coordinating conjunction, e.g. and, or, but
DET: determiner, e.g. a, an, the
INTJ: interjection, e.g. psst, ouch, bravo, hello
NOUN: noun, e.g. girl, cat, tree, air, beauty
NUM: numeral, e.g. 1, 2017, one, seventy-seven, IV, MMXIV
PART: particle, e.g. ’s, not,
PRON: pronoun, e.g I, you, he, she, myself, themselves, somebody
PROPN: proper noun, e.g. Mary, John, London, NATO, HBO
PUNCT: punctuation, e.g. ., (, ), ?
SCONJ: subordinating conjunction, e.g. if, while, that
SYM: symbol, e.g. $, %, §, ©, +, −, ×, ÷, =, :), 😛
VERB: verb, e.g. run, runs, running, eat, ate, eating
X: other, e.g. sfpksdpsxmsa
SPACE: space, e.g.
As a sidenote, while the SpaCy documentation states that its list follows the Universal Dependencies Scheme, SPACE is not part of this scheme, and is used for any spaces that appear beyond the normal ASCII spaces. This is something to bear in mind when cleaning, when the option to ‘normalize whitespace’ is available.
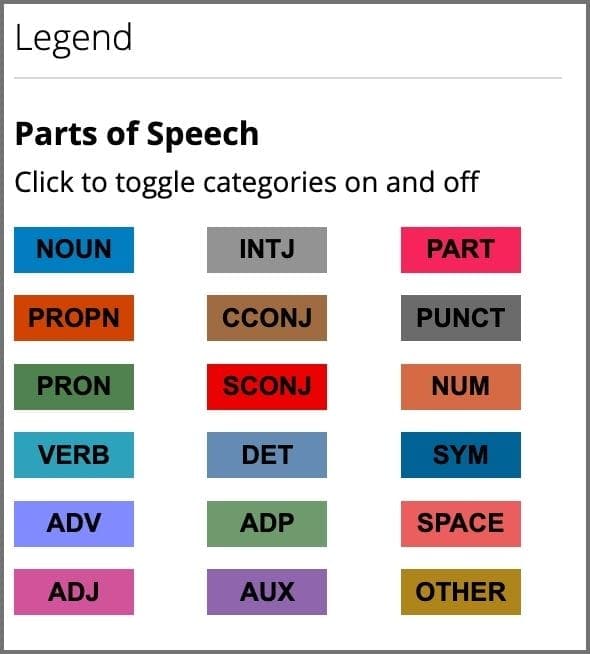
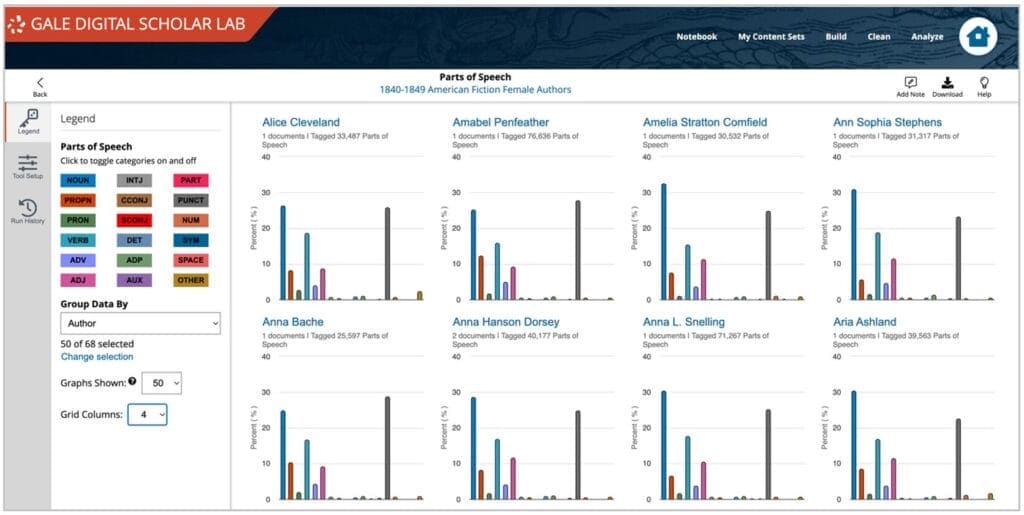
In the Lab, these category options are clearly labelled in the tool’s ‘Legend’, where toggling selections on and off will dynamically update the visualization display.
Structuring Content Sets for Comparative Analysis
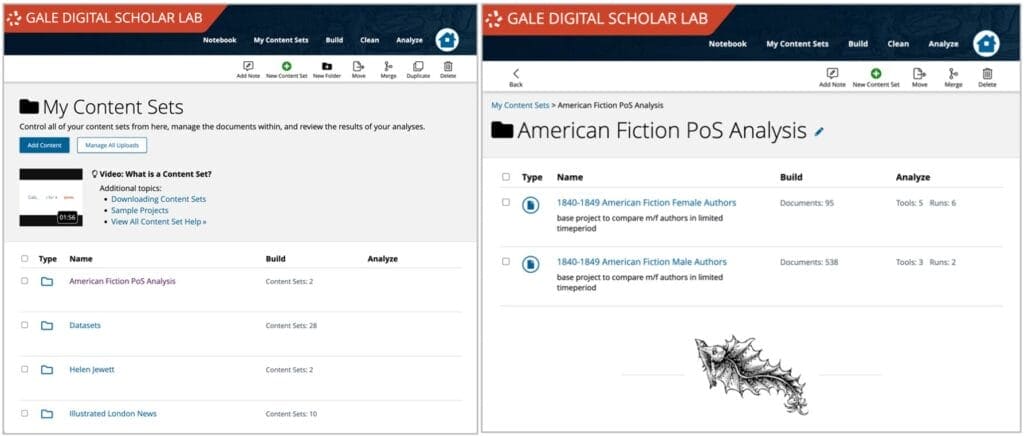
The Lab offers several practical solutions for organizing your research material to facilitate comparative analysis. In the ‘My Content Sets’ area, researchers can move their content sets into folders, or duplicate a large content set then begin to further curate it, perhaps by date, or author, or by publication type. The process of curation provides a pathway for developing comparative analyses in the Lab. The Notebook feature is embedded in each stage of this process so that full documentation can be generated, which is particularly important when a series of decisions is made about how to segment or curate data for analysis.
Cleaning Considerations
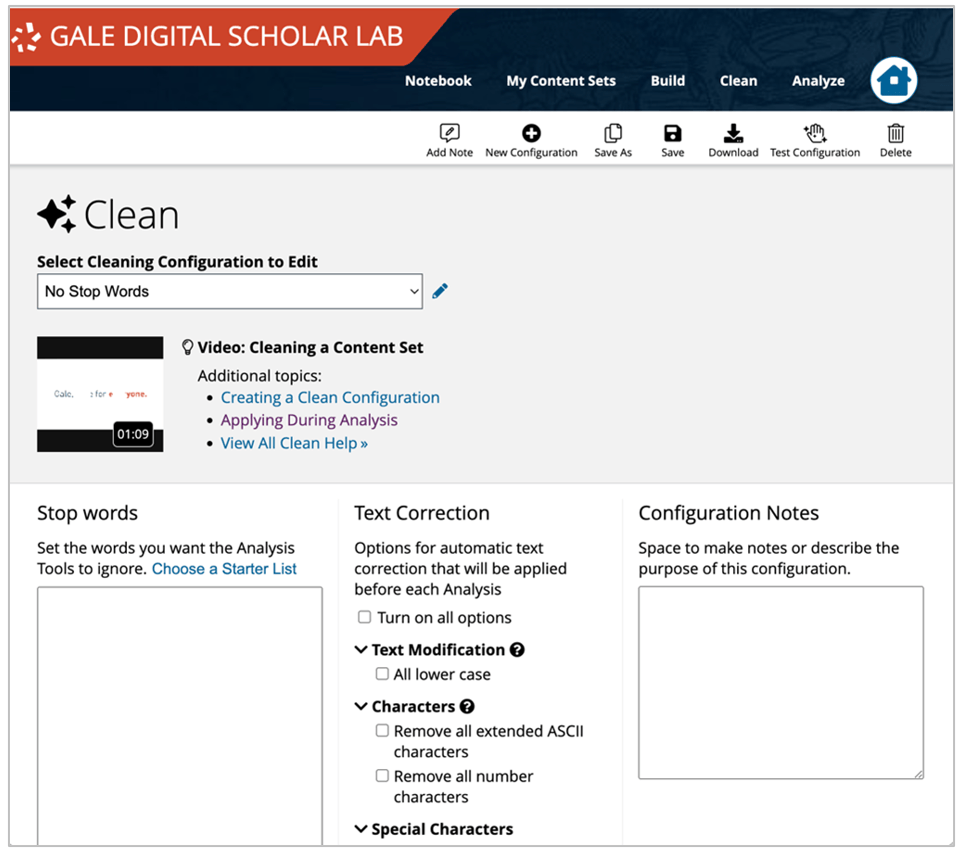
To develop a customized clean configuration relevant to the specific content sets a researcher is preparing for analysis, it’s important to develop an understanding of the type of texts and of the quality of OCR in the content set. Running an analysis with no clean configuration is always a good starting point, and ngrams can highlight recurrent OCR errors immediately, while running a PoS analysis can highlight areas for further refinement through the customization of cleaning configurations.
The PoS SpaCy model analyses the text based on syntactical and grammatical relationships. It’s therefore important not to remove stop words during a clean, since these words provide necessary context to generate accurate analysis results. It’s a simple process to ensure that stop words aren’t applied during analysis: clear the stop words box, then save the clean configuration anew.
Working with Parts-of-Speech Output
The analysis process for the PoS tool effectively creates a lexicographical index or dictionary of a content set. The output enables a user to compare authorship of documents in a content set, to evaluate changes in writing style over time, and to compare writings of different groups – for example, male and female – from same period.
The visualization generated from analysis output is generated by Highcharts.
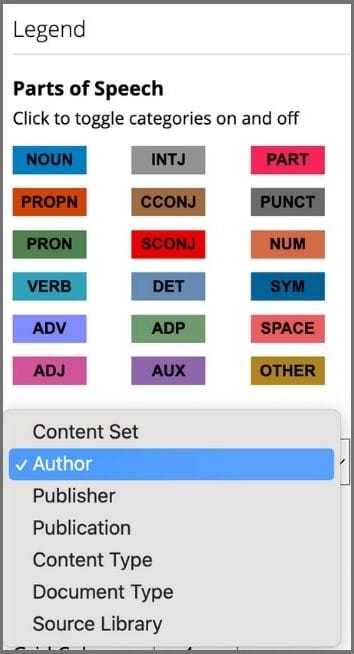
There are various customizations available from a dropdown menu in the view screen that enable researchers to target precise slices of data for further investigation. These include grouping by content set, author, publisher, publication, content type, document type and source library.
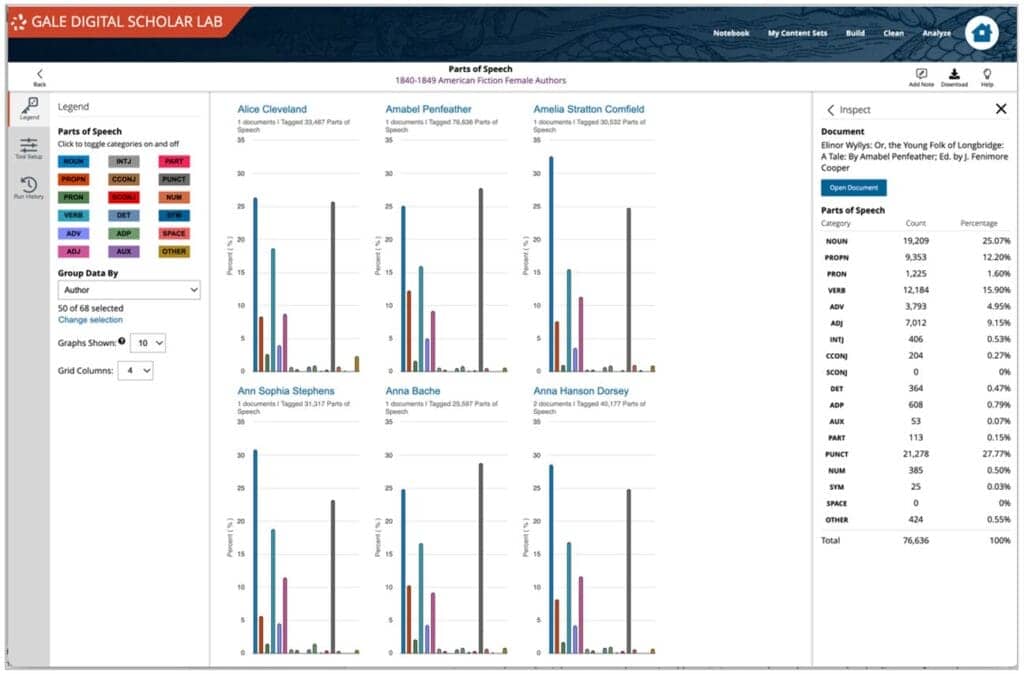
The number and layout of the bar graphs can also be customized. Up to 50 can be displayed at once, grouped by up to 4 grid columns wide. This allows for effective visual comparison across a wide range of data. Researchers can home in on individual documents to explore PoS usage:
Expanding the Possibilities: Download and Upload Options
Download options are offered in various formats, including CSV and JSON for raw analysis data and image formats for visualization output. This data can be exported for further analysis and curation outside of the Lab.
An important point to note is that author’s names are generated by existing metadata in Gale Primary Sources. There may be some duplications of names because of variant spellings or supplemental metadata. One strategy for working with variants of this nature is to export the metadata and OCR texts from the ‘My Content Sets’ page. Using a tool like OpenRefine can make swift work of identifying duplicates and merging chosen fields into a single entity. The Lab’s Upload feature will then enable re-ingestion of this content, using the provided metadata template.
The minimum metadata required for the tool to run is the author’s name and title, however, to fully take advantage of the multiple grouping options within the analysis page, it would be best to complete as many of the metadata fields as is practical.
Parts-of-Speech Project Work
Parts-of-Speech analysis lends itself well to comparative analysis, and to charting changes over time, for example, changes in language use over publication years or decades. Stylometry is a complementary research methodology. Here are a few examples of how this type of analysis has been used by scholars:
Weingart, Scott and Jorgensen, Jeana, “Computational Analysis of the Body in European Fairy Tales”Literary and Linguistic Computing / (2013): 404-416.
Available at https://digitalcommons.butler.edu/facsch_papers/678
Holst Katsma, ‘Loudness in the Novel’, Stanford Literary Lab, Pamphlet 7 https://litlab.stanford.edu/LiteraryLabPamphlet7.pdf
Schlomo Argamom et al, ‘Vive la Différence! Text Mining Gender Difference in French Literature’, DHQ 3:2, 2009 http://digitalhumanities.org:8081/dhq/vol/3/2/000042/000042.html
If you’d like to learn more, or see a demo of the tool in action, we have a webinar for you! It’s available here, along with a range of training and research webinars designed to support your work using Gale Digital Scholar Lab.
If you enjoyed reading about parts-of-speech tagging in the Lab, check out these posts:

